Statistical and finance
The Statistical and finance family contains 6 renderer-backed chart variants. Use this page as the entry point for choosing the right variant, then open the variant page for the screenshot, data shape, Rust API notes, and example code.
The chart family is still ordinary Fission UI. Each variant is constructed from typed Rust data, participates in layout and theme decisions, and can be driven by app state, reducers, resources, jobs, or services just like any other widget.
Variants
| Chart | Data shape | Use when |
|---|---|---|
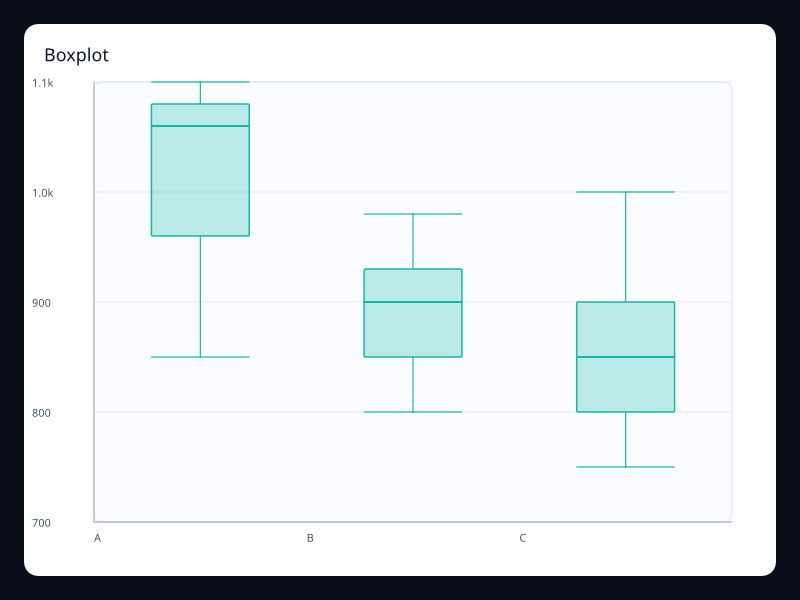
| Boxplot | Rows of five-number summaries or raw groups. | Use it when distribution matters more than a single average. |
| Bubble scatter | Vec<(x, y, size)>. | Use it when two axes are not enough and size can encode importance or volume. |
| Candlestick | Rows of open, close, low, high values. | Use it for finance and other range-over-time data. |
| Cartesian heatmap | x index, y index, and value triples. | Use it for density, activity, and matrix-style comparison. |
| Effect scatter | Vec<(f32, f32)> plus emphasis styling. | Use it to mark active locations, alerts, or selected results. |
| Scatter | Vec<(f32, f32)>. | Use it to find relationship, clustering, or outliers. |
Choosing within this family
Start with the user's question, not the visual effect. Pick the simplest variant that makes the answer clear, add interaction only when it reduces work for the user, and keep animation purposeful enough that it explains a change rather than decorating the page.