Radial
The Radial family contains 20 renderer-backed chart variants. Use this page as the entry point for choosing the right variant, then open the variant page for the screenshot, data shape, Rust API notes, and example code.
The chart family is still ordinary Fission UI. Each variant is constructed from typed Rust data, participates in layout and theme decisions, and can be driven by app state, reducers, resources, jobs, or services just like any other widget.
Variants
| Chart | Data shape | Use when |
|---|---|---|
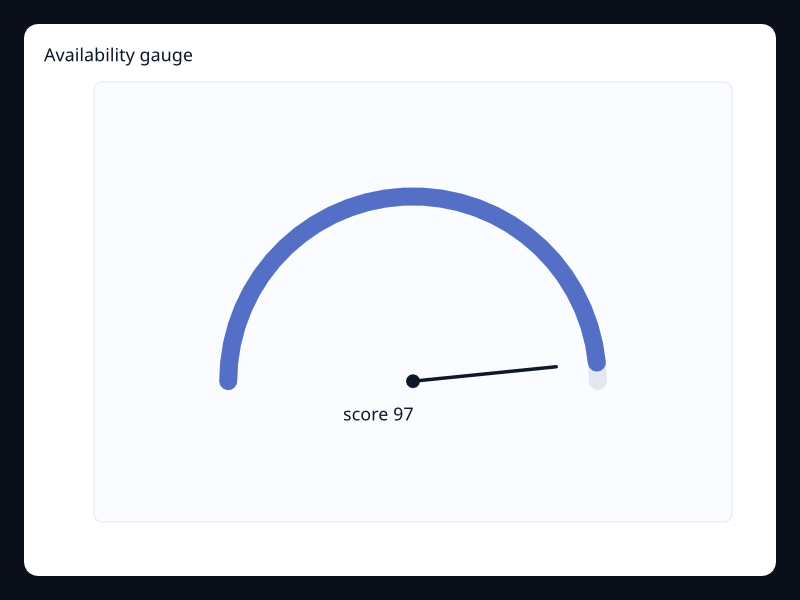
| Availability gauge | One bounded value mapped to an arc. | Use it when a single current status dominates the screen. |
| Build confidence gauge | One confidence score on a gauge arc. | Use it when a status panel needs a primary quality number. |
| Capacity headroom gauge | Single capacity value in a bounded range. | Use it when headroom is the only number that matters. |
| Cycle polar line | Angle/radius samples around a cycle. | Use it for circular process metrics. |
| Deploy health gauge | Single score value in a bounded range. | Use it for health and readiness summaries. |
| Device donut | Label/value pairs with an open center. | Use it when the center can carry a total or primary label. |
| Expense donut | Expense categories as a small whole. | Use it for budget composition. |
| Exposure area rose | Label/value pairs with area-oriented rose layout. | Use it when relative shape is more important than a precise angle. |
| Hourly load polar bars | Label/value pairs around a circle. | Use it when cyclic position is meaningful. |
| Market rose | Label/value pairs with radius emphasis. | Use it when presentation value is high and categories are few. |
| Plan share pie | Label/value pairs for a small whole. | Use it when part-to-whole reading is the main task. |
| Platform readiness radar | Platform dimensions as comparable vectors. | Use it to summarize readiness across product areas. |
| Product fit radar | Several same-length dimensional vectors. | Use it to compare shapes across a few dimensions. |
| Revenue mix donut | Revenue categories as label/value pairs. | Use it when contribution to total revenue matters. |
| Risk rose | Risk category values in radial form. | Use it for executive risk snapshots where visual emphasis helps. |
| Seasonality polar bars | Cyclic label/value pairs. | Use it when the shape wraps around a repeated cycle. |
| Service health radar | Health dimensions on a radial profile. | Use it for compact status summaries. |
| Source mix pie | Traffic or source categories with values. | Use it for small source distributions. |
| Team balance radar | Team capability vectors. | Use it when balance across dimensions is the main reading. |
| Wind speed polar line | Angle/radius samples. | Use it for directional or cyclic measures. |
Choosing within this family
Start with the user's question, not the visual effect. Pick the simplest variant that makes the answer clear, add interaction only when it reduces work for the user, and keep animation purposeful enough that it explains a change rather than decorating the page.