Pie and radial
The Pie and radial family contains 12 renderer-backed chart variants. Use this page as the entry point for choosing the right variant, then open the variant page for the screenshot, data shape, Rust API notes, and example code.
The chart family is still ordinary Fission UI. Each variant is constructed from typed Rust data, participates in layout and theme decisions, and can be driven by app state, reducers, resources, jobs, or services just like any other widget.
Variants
| Chart | Data shape | Use when |
|---|---|---|
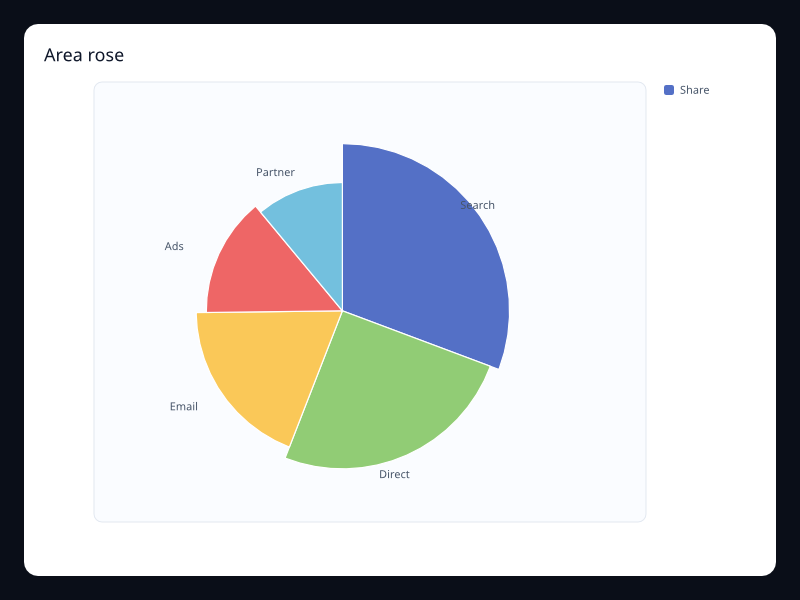
| Area rose | Label/value pairs with rose area mode. | Use it when small values should remain visible. |
| Capacity gauge | One bounded value. | Use it for operational capacity panels. |
| Cyclic polar bars | Label/value pairs in polar coordinates. | Use it for cyclical categories. |
| Device mix donut | Label/value pairs plus inner radius. | Use it when the total belongs in the center of the chart. |
| Market share pie | Label/value pairs. | Use it for small composition snapshots. |
| Nested-style donut | Label/value pairs plus inner radius. | Use it when a central status label will be added by surrounding UI. |
| Presentation rose | Label/value pairs with rose radius mode. | Use it for presentation views with few categories. |
| Radar profile A | Vec<Vec<f32>> metric profiles. | Use it for capability or budget profiles. |
| Radar profile B | Vec<Vec<f32>> metric profiles. | Use it when the profile shape matters. |
| Score gauge | One label/value pair. | Use it for health or readiness scores. |
| Two-level donut | Label/value pairs plus inner radius. | Use it for compact composition summaries. |
| Wind polar line | Angle/radius samples. | Use it for direction and magnitude data. |
Choosing within this family
Start with the user's question, not the visual effect. Pick the simplest variant that makes the answer clear, add interaction only when it reduces work for the user, and keep animation purposeful enough that it explains a change rather than decorating the page.