Monitoring
The Monitoring family contains 20 renderer-backed chart variants. Use this page as the entry point for choosing the right variant, then open the variant page for the screenshot, data shape, Rust API notes, and example code.
The chart family is still ordinary Fission UI. Each variant is constructed from typed Rust data, participates in layout and theme decisions, and can be driven by app state, reducers, resources, jobs, or services just like any other widget.
Variants
| Chart | Data shape | Use when |
|---|---|---|
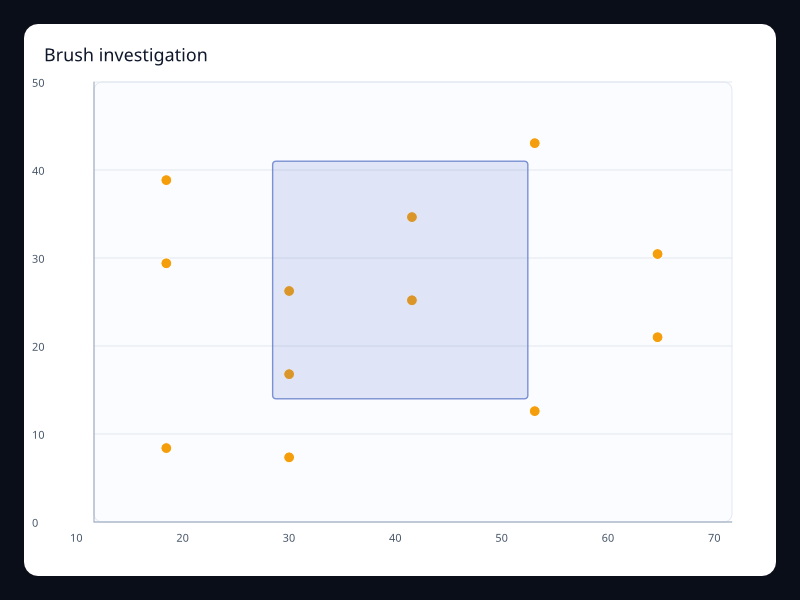
| Brush investigation | Scatter points and brush selection. | Use it when incidents require selecting a point range. |
| Capacity gauge | One capacity value in a bounded range. | Use it for critical status cards. |
| Dependency graph | Service nodes and dependencies. | Use it for operational topology. |
| Error scatter | Highlighted error points. | Use it for outlier-heavy operational views. |
| Load heatmap | Resource load matrix. | Use it for time and resource concentration. |
| Monitoring 3D cloud | 3D point cloud of operational samples. | Use it for dense spatial monitoring views. |
| Monitoring 3D grid | 3D grid bars for operational values. | Use it for spatial operational demonstrations. |
| Monitoring annotation | Trend with typed graphic callout. | Use it when dashboards need explanatory context. |
| Monitoring error band | Error values with threshold band. | Use it when alert ranges must be visible. |
| Monitoring event strip | Event positions with value-coded marks. | Use it for compact event timeline rows. |
| Monitoring overview line | Dense telemetry samples. | Use it for top-level operational dashboards. |
| Monitoring risk radar | Multidimensional status vector. | Use it for status summaries across dimensions. |
| Monitoring toolbox | Line chart with analysis actions. | Use it when charts need local analysis controls. |
| Monitoring traffic bars | Traffic counts by category. | Use it for quick categorical traffic summaries. |
| Operational flow sankey | Flow nodes and links. | Use it for request and process flow. |
| Operational region map | Region values with color scale. | Use it for geographic operations. |
| Operational route lines | Connection lines with effect markers. | Use it for route and link movement. |
| Release timeline | Timeline control over chart state. | Use it for release-based dashboards. |
| Service rank | Services ranked by a value. | Use it to focus on the largest contributors. |
| Uptime calendar | Daily uptime values. | Use it for long-term reliability summaries. |
Choosing within this family
Start with the user's question, not the visual effect. Pick the simplest variant that makes the answer clear, add interaction only when it reduces work for the user, and keep animation purposeful enough that it explains a change rather than decorating the page.