Interaction
The Interaction family contains 20 renderer-backed chart variants. Use this page as the entry point for choosing the right variant, then open the variant page for the screenshot, data shape, Rust API notes, and example code.
The chart family is still ordinary Fission UI. Each variant is constructed from typed Rust data, participates in layout and theme decisions, and can be driven by app state, reducers, resources, jobs, or services just like any other widget.
Variants
| Chart | Data shape | Use when |
|---|---|---|
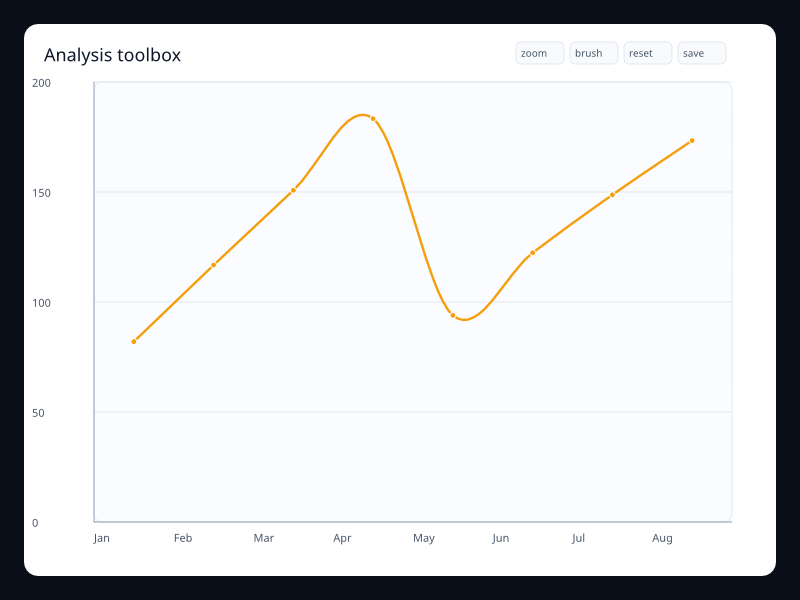
| Analysis toolbox | Chart data with explicit utility actions. | Use it when analysis actions belong close to the chart. |
| Annotation callout | Chart data with a typed text callout. | Use it for guided dashboards and reports. |
| Axis tooltip | Series data with axis-oriented tooltip intent. | Use it when the whole axis position is the hover target. |
| Breach mark area | Line values with highlighted breach band. | Use it when unsafe ranges need visible boundaries. |
| Brush outliers | Point data with visible brush preview. | Use it for exploratory selection. |
| Brush region | Scatter points plus brush rectangle configuration. | Use it when users select data before drilling in. |
| Capacity timeline | Period labels with changing chart state. | Use it for capacity changes across time. |
| Data zoom overview | Ordered data with a selected zoom range. | Use it for long series where one window is active. |
| Deployment marks | Trend data with event mark points. | Use it when specific moments explain the data. |
| Export toolbox | Chart data with restore, brush, zoom, and save actions. | Use it when chart controls need a consistent built-in place. |
| Graphic band | Chart plus typed rect, text, and line graphics. | Use it for callouts and shaded product ranges. |
| Graphic note | Trend line with typed graphic overlay. | Use it to add explanations without leaving the chart model. |
| Grouped tooltip | Grouped series with tooltip intent. | Use it when comparison needs hover detail. |
| Item tooltip | Series data with item-level tooltip intent. | Use it when individual marks carry detail. |
| Marked SLO chart | Trend data plus mark lines and shaded bands. | Use it to keep thresholds in the chart instead of external notes. |
| Restore toolbox | Chart data with reset action included. | Use it when user exploration needs a safe reset. |
| Selectable scatter | Scatter points with selection configuration. | Use it when users inspect clusters interactively. |
| Telemetry zoom | Long ordered telemetry values with zoom. | Use it for monitoring and investigation. |
| Timeline releases | Chart data with release timeline options. | Use it for versioned or period-based views. |
| Timeline years | Chart data with a timeline control. | Use it when the same view switches between periods. |
Choosing within this family
Start with the user's question, not the visual effect. Pick the simplest variant that makes the answer clear, add interaction only when it reduces work for the user, and keep animation purposeful enough that it explains a change rather than decorating the page.