Heatmap and calendar
The Heatmap and calendar family contains 12 renderer-backed chart variants. Use this page as the entry point for choosing the right variant, then open the variant page for the screenshot, data shape, Rust API notes, and example code.
The chart family is still ordinary Fission UI. Each variant is constructed from typed Rust data, participates in layout and theme decisions, and can be driven by app state, reducers, resources, jobs, or services just like any other widget.
Variants
| Chart | Data shape | Use when |
|---|---|---|
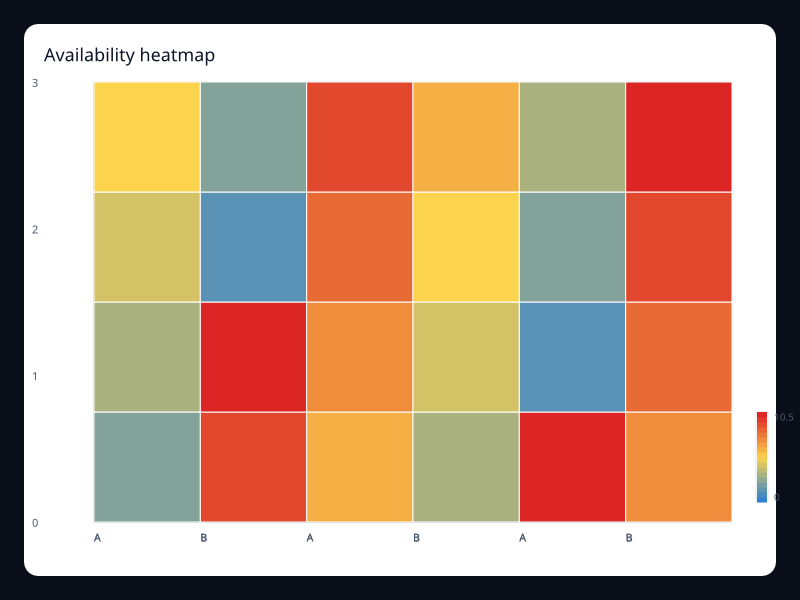
| Availability heatmap | Matrix value triples. | Use it for SRE and operations dashboards. |
| Build calendar | Date/value pairs. | Use it for engineering operations. |
| Correlation heatmap | Matrix value triples. | Use it for relationship strength matrices. |
| Incident calendar | Date/value pairs. | Use it for reliability and support reporting. |
| Large matrix heatmap | Dense matrix value triples. | Use it for activity grids with many columns. |
| Quarter calendar heatmap | Date/value pairs. | Use it for contribution and activity patterns. |
| Resource load heatmap | Matrix value triples. | Use it for capacity and utilization panels. |
| Retention calendar | Date/value pairs. | Use it for habit and retention surfaces. |
| Risk grid heatmap | Matrix value triples. | Use it for risk and priority matrices. |
| Small matrix heatmap | Matrix value triples. | Use it for dashboards with limited space. |
| Visual map density | HeatmapSeries plus VisualMap. | Use it when color needs a visible numeric range. |
| Weekday hour heatmap | x index, y index, value triples. | Use it for operational intensity matrices. |
Choosing within this family
Start with the user's question, not the visual effect. Pick the simplest variant that makes the answer clear, add interaction only when it reduces work for the user, and keep animation purposeful enough that it explains a change rather than decorating the page.