Geo and route
The Geo and route family contains 10 renderer-backed chart variants. Use this page as the entry point for choosing the right variant, then open the variant page for the screenshot, data shape, Rust API notes, and example code.
The chart family is still ordinary Fission UI. Each variant is constructed from typed Rust data, participates in layout and theme decisions, and can be driven by app state, reducers, resources, jobs, or services just like any other widget.
Variants
| Chart | Data shape | Use when |
|---|---|---|
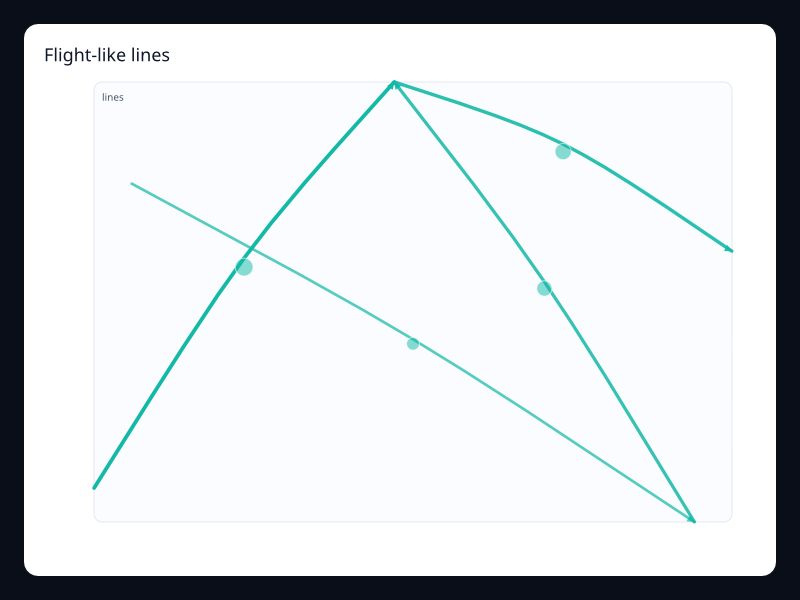
| Flight-like lines | LineSegment values plus effect. | Use it for route animation-style visuals. |
| Geo network | GeoJSON plus lines. | Use it for network coverage and paths. |
| Migration routes | LineSegment values. | Use it for movement and transfer flows. |
| Region value map | GeoJSON regions plus values. | Use it for geography-first comparisons. |
| Risk map | GeoJSON regions plus numeric values. | Use it for geographic risk dashboards. |
| Route arcs | Line segments with values. | Use it for logistics and movement. |
| Route map overlay | GeoJSON regions plus route segments. | Use it when geography and movement combine. |
| Sales map | GeoJSON regions plus values. | Use it for regional business metrics. |
| Service coverage map | GeoJSON regions plus values. | Use it for coverage and rollout screens. |
| Traffic lines | LineSegment values. | Use it for traffic or flow intensity. |
Choosing within this family
Start with the user's question, not the visual effect. Pick the simplest variant that makes the answer clear, add interaction only when it reduces work for the user, and keep animation purposeful enough that it explains a change rather than decorating the page.