Dataset
The Dataset family contains 20 renderer-backed chart variants. Use this page as the entry point for choosing the right variant, then open the variant page for the screenshot, data shape, Rust API notes, and example code.
The chart family is still ordinary Fission UI. Each variant is constructed from typed Rust data, participates in layout and theme decisions, and can be driven by app state, reducers, resources, jobs, or services just like any other widget.
Variants
| Chart | Data shape | Use when |
|---|---|---|
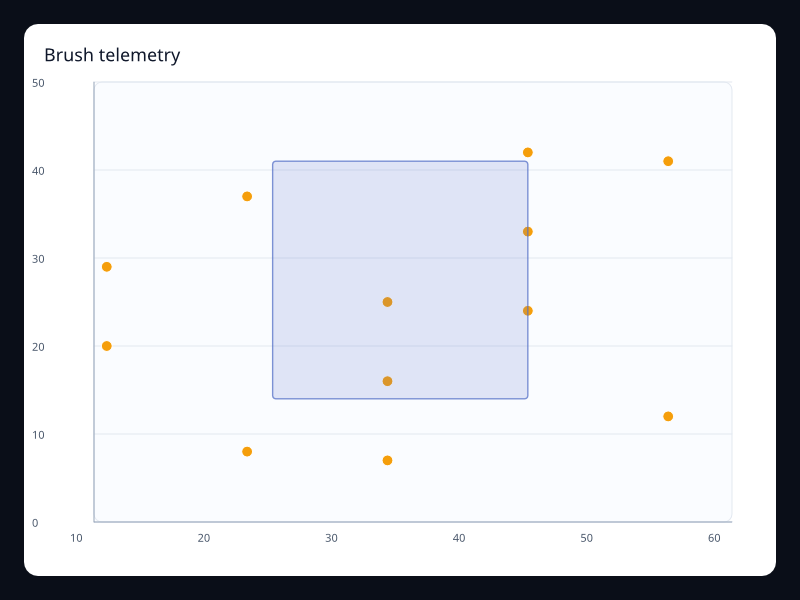
| Brush telemetry | Point samples with brush selection. | Use it for interactive telemetry exploration. |
| Calendar dataset activity | Date/value rows mapped to a calendar. | Use it when dates are a first-class data field. |
| Coverage dataset map | Region/value rows. | Use it when geographic views come from named records. |
| Dataset visual heatmap | Encoded grid cells with values. | Use it when heatmaps come from generic records. |
| Filtered composition | Filtered label/value rows. | Use it when the chart represents a selected dataset slice. |
| Flow dataset sankey | Node and edge records. | Use it when flow data is modeled explicitly. |
| Live activation funnel | Changing stage values. | Use it when pipeline stages update during the session. |
| Live alert scatter | Highlighted alert points. | Use it for active events and outliers. |
| Live bar update | Changing category values. | Use it for updating status summaries. |
| Live line update | Append-like ordered telemetry samples. | Use it for live monitoring views. |
| Live radar score | Changing dimension vectors. | Use it for live multidimensional scorecards. |
| Live status gauge | Single changing status value. | Use it when a live number needs a strong visual shape. |
| Product trend dataset | Tabular data encoded into line series. | Use it when named fields should drive series values. |
| Products by year dataset | Tabular product/year/value records. | Use it when several chart views should share one dataset. |
| Quality dataset parallel | Rows with several numeric dimensions. | Use it when the same table powers multidimensional analysis. |
| Quarter timeline | Period labels switching chart state. | Use it for period-over-period analysis. |
| Ranked dataset bars | Rows sorted into category/value pairs. | Use it when rank comes from data transformation. |
| Risk bubbles dataset | Rows encoded into x, y, and size. | Use it when one table feeds bubble visualization. |
| Stacked revenue dataset | Multiple encoded measures over one category axis. | Use it when stack series share the same source table. |
| Telemetry toolbox | Telemetry chart with built-in actions. | Use it when live charts need controlled exploration. |
Choosing within this family
Start with the user's question, not the visual effect. Pick the simplest variant that makes the answer clear, add interaction only when it reduces work for the user, and keep animation purposeful enough that it explains a change rather than decorating the page.