Data pipeline and interaction
The Data pipeline and interaction family contains 3 renderer-backed chart variants. Use this page as the entry point for choosing the right variant, then open the variant page for the screenshot, data shape, Rust API notes, and example code.
The chart family is still ordinary Fission UI. Each variant is constructed from typed Rust data, participates in layout and theme decisions, and can be driven by app state, reducers, resources, jobs, or services just like any other widget.
Variants
| Chart | Data shape | Use when |
|---|---|---|
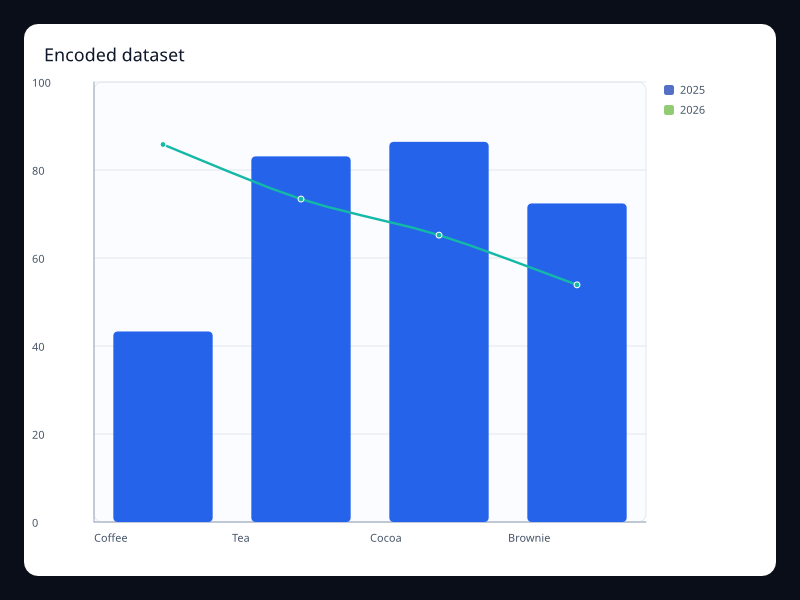
| Encoded dataset | Dataset rows, dimensions, and encode mappings. | Use it when chart code should name fields instead of copying arrays. |
| Visual map | Numeric values plus a color scale. | Use it for heatmap and scatter intensity. |
| Word cloud | Label/value pairs where the label is the word and the value controls size. | Use it for qualitative summaries where exact numeric comparison is less important than emphasis. |
Choosing within this family
Start with the user's question, not the visual effect. Pick the simplest variant that makes the answer clear, add interaction only when it reduces work for the user, and keep animation purposeful enough that it explains a change rather than decorating the page.