Coordinates
The Coordinates family contains 4 renderer-backed chart variants. Use this page as the entry point for choosing the right variant, then open the variant page for the screenshot, data shape, Rust API notes, and example code.
The chart family is still ordinary Fission UI. Each variant is constructed from typed Rust data, participates in layout and theme decisions, and can be driven by app state, reducers, resources, jobs, or services just like any other widget.
Variants
| Chart | Data shape | Use when |
|---|---|---|
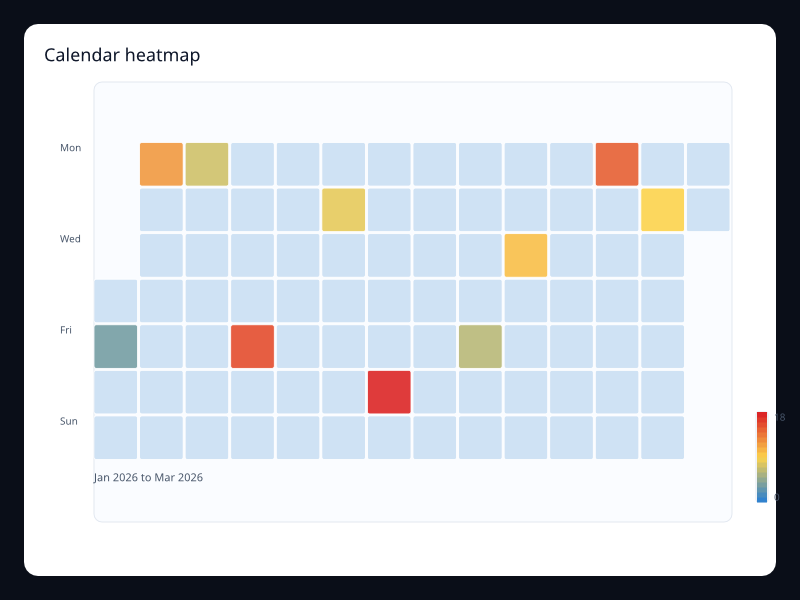
| Calendar heatmap | Date/value pairs using YYYY-MM-DD dates. | Use it for contribution, activity, incident, and habit patterns over weeks or months. |
| Polar bar | Label/value pairs rendered as radial bar segments. | Use it when cyclical comparison benefits from circular layout. |
| Polar line | Vec<(angle_degrees, radius)>. | Use it for wind, direction, periodic signals, and angular measurements. |
| Single axis | Vec<(value, size)> on a single horizontal scale. | Use it for timelines, distributions, and event density when a second axis would add noise. |
Choosing within this family
Start with the user's question, not the visual effect. Pick the simplest variant that makes the answer clear, add interaction only when it reduces work for the user, and keep animation purposeful enough that it explains a change rather than decorating the page.