Components and interaction
The Components and interaction family contains 23 renderer-backed chart variants. Use this page as the entry point for choosing the right variant, then open the variant page for the screenshot, data shape, Rust API notes, and example code.
The chart family is still ordinary Fission UI. Each variant is constructed from typed Rust data, participates in layout and theme decisions, and can be driven by app state, reducers, resources, jobs, or services just like any other widget.
Variants
| Chart | Data shape | Use when |
|---|---|---|
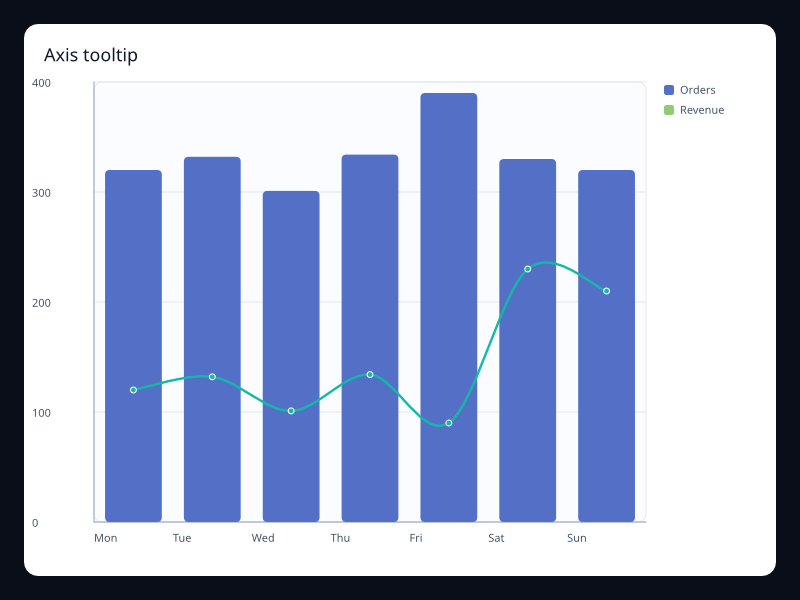
| Axis tooltip | Tooltip::axis_trigger plus series data under shared axes. | Use it when several series share one x position and the user needs exact values. |
| Brush horizontal | ChartBrush plus ScatterSeries. | Use it for x-range selection. |
| Brush rectangle | ChartBrush plus ScatterSeries. | Use it for region selection. |
| Brush selection | ChartBrush configuration plus hit-testable series data. | Use it when users need to select or inspect a region of points. |
| Data zoom | DataZoom start and end percentages plus ordered series data. | Use it when the user needs to inspect a slice of a longer series without leaving context. |
| Data zoom long | DataZoom plus LineSeries. | Use it for dashboards with focus ranges. |
| Data zoom short | DataZoom plus LineSeries. | Use it for local inspection of long series. |
| Graphic band | ChartGraphic plus LineSeries. | Use it for release windows and custom callouts. |
| Graphic callout | ChartGraphic plus LineSeries. | Use it to explain a change in context. |
| Graphic overlay | ChartGraphic rect, text, line, or circle records. | Use it for callouts, annotations, labels, and lightweight explanatory overlays. |
| Mark area component | MarkArea plus LineSeries. | Use it for safe operating zones. |
| Mark line and point | MarkArea, MarkLine, and MarkPoint records attached to a chart. | Use it to explain thresholds, goals, anomalies, or operational bands directly on the chart. |
| Mark line component | MarkLine plus LineSeries. | Use it for goals and alert thresholds. |
| Mark point component | MarkPoint plus LineSeries. | Use it for incidents and milestones. |
| Timeline | ChartTimeline labels and current index. | Use it to show snapshots, scenario years, deployment phases, or step-based playback. |
| Timeline releases | ChartTimeline plus series. | Use it for phase or scenario playback. |
| Timeline years | ChartTimeline plus series. | Use it for step-based snapshots. |
| Toolbox actions | ChartInteraction toolbox action list. | Use it when a chart has explicit utility operations that should remain close to the data. |
| Toolbox full | ChartInteraction toolbox actions. | Use it when a chart supports several operations. |
| Toolbox zoom | ChartInteraction toolbox actions. | Use it for chart utility operations. |
| Tooltip axis component | Tooltip plus ChartInteraction. | Use it for exact values across series. |
| Tooltip item component | Tooltip item trigger. | Use it for exact item readout. |
| Visual map component | VisualMap plus HeatmapSeries. | Use it where color represents a numeric value. |
Choosing within this family
Start with the user's question, not the visual effect. Pick the simplest variant that makes the answer clear, add interaction only when it reduces work for the user, and keep animation purposeful enough that it explains a change rather than decorating the page.