Analytics
The Analytics family contains 20 renderer-backed chart variants. Use this page as the entry point for choosing the right variant, then open the variant page for the screenshot, data shape, Rust API notes, and example code.
The chart family is still ordinary Fission UI. Each variant is constructed from typed Rust data, participates in layout and theme decisions, and can be driven by app state, reducers, resources, jobs, or services just like any other widget.
Variants
| Chart | Data shape | Use when |
|---|---|---|
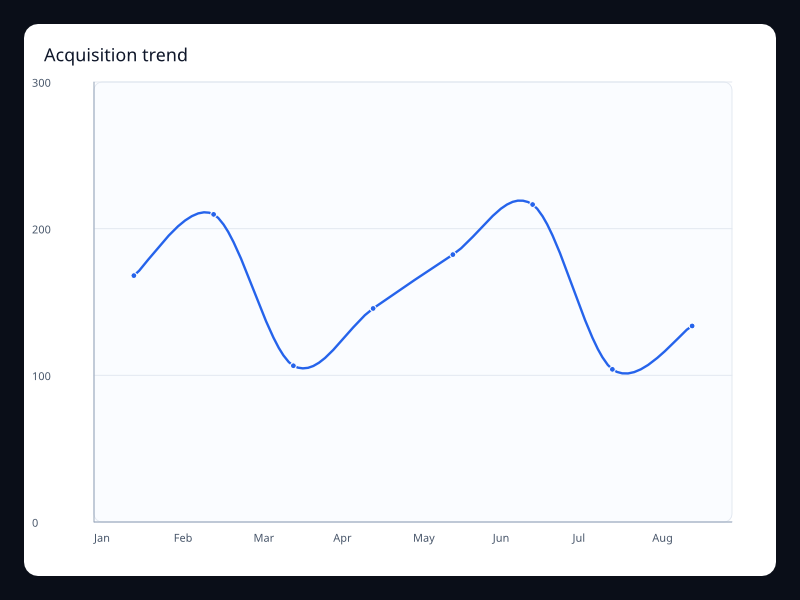
| Acquisition trend | Acquisition values over time. | Use it for growth dashboards. |
| Analytics score gauge | One score value in a bounded range. | Use it for primary scorecards. |
| Channel stack | Channel values stacked by category. | Use it for acquisition mix. |
| Cohort heatmap | Cohort matrix values. | Use it for retention and cohort intensity. |
| Conversion funnel | Ordered conversion stage values. | Use it for product funnel analysis. |
| Device mix donut | Device values in a donut chart. | Use it when device share matters. |
| Engagement calendar | Daily engagement values. | Use it for engagement consistency over time. |
| Engagement routes | Map plus route lines. | Use it for spatial engagement flows. |
| Feature treemap | Feature values in a hierarchy. | Use it for feature usage share. |
| Journey graph | Journey nodes and links. | Use it for relationship-heavy behavior views. |
| Journey sankey | Journey stages and flow links. | Use it for user movement between stages. |
| Market share pie | Label/value market share pairs. | Use it for small whole comparisons. |
| Portfolio sunburst | Portfolio hierarchy in radial layers. | Use it for hierarchical portfolio composition. |
| Product radar | Product dimensions as profile vectors. | Use it to compare product health dimensions. |
| Region sales map | Sales values by named region. | Use it for geographic sales analysis. |
| Report toolbox chart | Chart with report actions. | Use it when analytics views need built-in controls. |
| Retention area | Retention values with area fill. | Use it when volume and trend both matter. |
| Segment bubbles | Segment x, y, and value triples. | Use it for multidimensional segment comparison. |
| Segment parallel | Segment rows across several dimensions. | Use it for segment tradeoff analysis. |
| Source theme river | Source values over time. | Use it for changing source composition. |
Choosing within this family
Start with the user's question, not the visual effect. Pick the simplest variant that makes the answer clear, add interaction only when it reduces work for the user, and keep animation purposeful enough that it explains a change rather than decorating the page.